
A hard drive is one of the most delicate and important parts of a PC. It needs regular maintenance, such as defragmenting and cleaning, to keep its data in good shape. However, even with the best care, a hard drive will eventually fail. Sometimes you can notice the signs, sometimes it crashes unexpectedly in the midst of something important, and sometimes it just won’t start one day. With ULINK’s DA Drive Analyzer powered by a cloud AI engine, you can easily check the health of your drives and prevent unexpected crashes. Let’s see how.
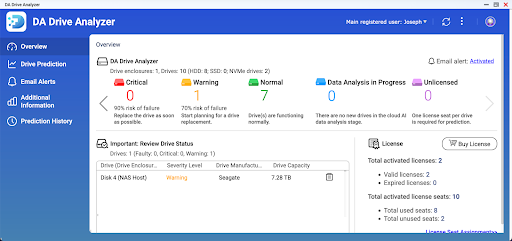
Dashboard of Drive Health Status
The goal of the ULINK DA Drive Analyzer is to continuously track drive health data such as S.M.A.R.T. attributes, temperature, and test IOPS and then analyze drive failure possibility. This analysis is what you see on the dashboard. It would tell the user in a quick glance how many drives are healthy, how many are at moderate risk, how many are critical risk, and how many have health indicators that have crossed system-specific thresholds (faulty).
Life Prediction Score
ULINK DA Drive Analyzer analyzes historical usage data from millions of drives to provide intelligent forecasts for potential drive failures. Based on algorithms, it comes up with a Life Prediction Score that indicates how healthy a drive is. The lower the score, the lower the health of your drive.
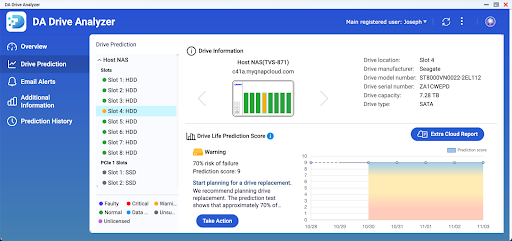
For example, a Life Prediction score of 10 indicates a healthy and normal drive. When the Life Prediction Score drops below 9.5, the software would send out a warning through email notifications and alerts. A score below 4.5 indicates that the drive is in a critical state and should be replaced or backed up to avoid data loss.
Symptom Radar Chart
To understand the severity of the health of your at-risk drives, you can use the Symptom Radar Chart. The polygon-shaped radar chart summarizes each drive’s health parameters along five symptom axes: S.M.A.R.T., Temperature, Drive-Detected Issues, Self-Test, and Host-Detected Issues.
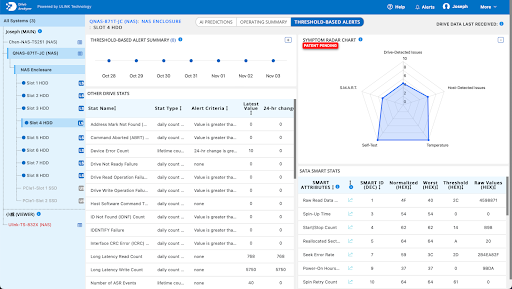
A lower axis score indicates poorer health along the corresponding health axis. For example, if a drive has a lower axis score of 7 on the S.M.A.R.T. axis, the drive has a 70% chance of remaining with the user over the next year according to historical S.M.A.R.T. data.
Keeping track of the little warning signs that drives display from time to time will help you check the health of your drive and take the necessary action at the right time to prevent a drive failure.
QNAP and ULINK Release DA Drive Analyzer, AI-powered Drive Failure Prediction Tool for NAS
Photo Credit:oat_s
Recent Comments