
Data is the lifeblood of organizations in an increasingly digital world, so it is critical to ensure the optimal health and performance of storage drives. Host detected issues are a group of storage drive symptoms that can serve as an early indicator of potential drive failures or performance degradation.
What are Host Detected Issues?
Just as a car driver recognizes unusual sounds or behaviors as signs of potential issues with their vehicle, drive hosts can identify anomalies or deviations from expected performance metrics based on their interactions with drives. These anomalies are called host detected issues.
Examples of Host Detected Issues
Long Latency Write Count: These are write commands sent from the host computer to the drive that exceed a specified time threshold. Such delays indicate potential performance bottlenecks or underlying issues with the drive’s responsiveness.
Read Retry Count: When an initial read command fails, the host re-issues the command to retrieve the data. An elevated read retry count suggests potential data retrieval challenges or inconsistencies in drive performance.
Locating Host Detected Issues on DA Portal
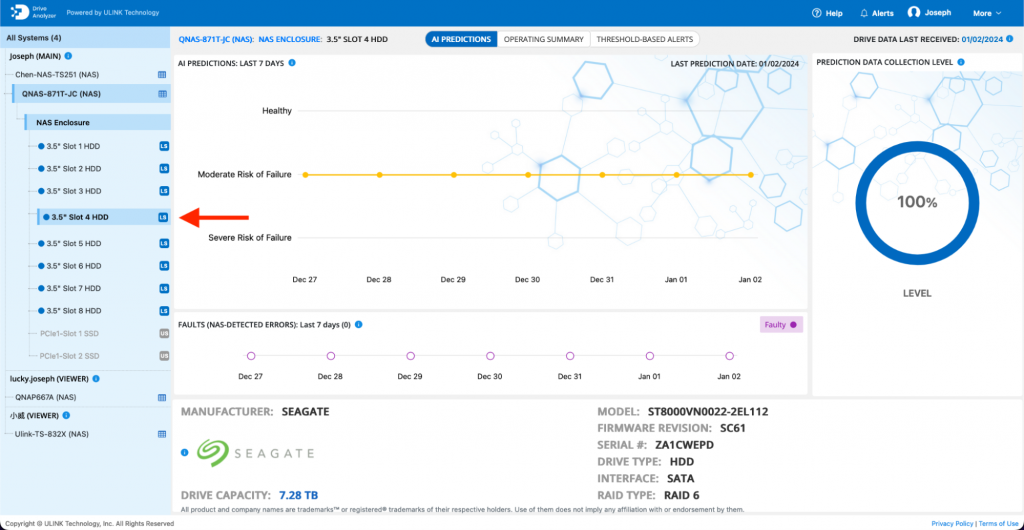
The DA Portal serves as a comprehensive platform for drive monitoring, analysis, and maintenance. To identify host detected issues:
a) Navigate to the Drive Level: Within the DA Portal, access the drive level interface to view detailed metrics and performance indicators.
b) Threshold-Based Alerts Tab: Expand the ‘Threshold-Based Alerts’ tab to access a range of alert categories and metrics.
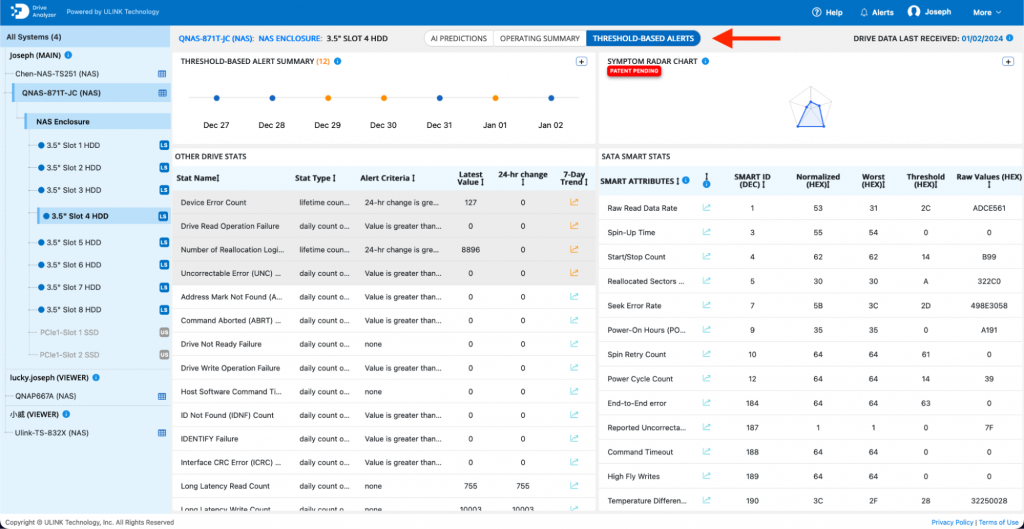
c) Symptom Radar Chart:
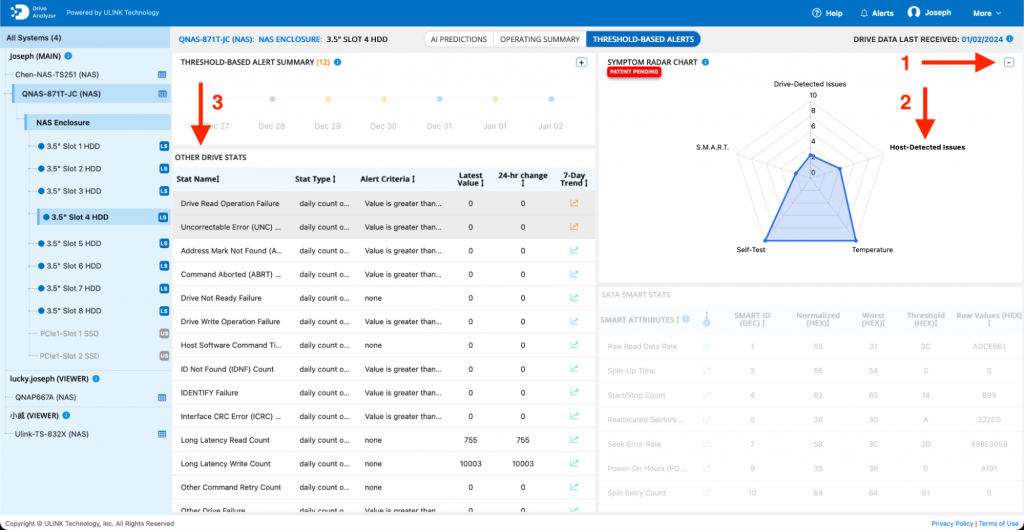
i) Within the Threshold-Based Alerts section, locate the Symptom Radar Chart graphic. Expand the graphic into a full chart.
ii) Click on the ‘Host-Detected Issues’ axis within the chart to filter Host-Detected Issues.
iii) The various Host-Detected Issues, including long latency write counts, read retry counts, and other anomalies, will be displayed under the ‘Other Drive Stats’ section.
Host detected issues, such as long latency writes and read retry counts, serve as early warning signs of potential drive issues or performance degradation. By proactively monitoring and addressing host detected issues through the ULINK DA Portal, organizations can adopt a preventive and predictive maintenance approach. This proactive strategy enables timely intervention, minimizing downtime, optimizing drive performance, and safeguarding critical data assets.
QNAP and ULINK Release DA Drive Analyzer, AI-powered Drive Failure Prediction Tool for NAS
Photo Credit: Anton Vierietin
Recent Comments